I recently optimized a client website who is hosted on WP Engine.
I am not a fan of managed hosting providers since they add a lot of restrictions, and I prefer to have the maximum control over.
Although these providers add some general rules for improving your website’s performance, these general rules do not work well for every website.
WP Engine uses aggressive caching techniques, which causes random issues at times.
For instance, I was trying to deactivate a plugin. Everything seemed okay, but after the page refreshed, the plugin was still in active state.
Anyways, I had clone the client website to my high frequency Vultr instance in Chicago, and set it up using RunCloud, NGINX server. WP Engine also uses NGINX under the hood.
I will do a TTFB comparison as that gives a good idea of the cache performance.
Both the live & the optimized websites use WP Rocket.
I have added some custom NGINX rules to improve the cache performance.
I am using SpeedVitals for comparing the performance.
TTFB of my setup from America
| Location (US) | TTFB (ms) | Improvement (%) | Improvement (abs) | |
|---|---|---|---|---|
| RunCloud (my setup) | WP Engine | |||
| Las Vegas, US | 212 ms | 263 ms | 21% | 51 ms |
| Iowa, US | 109 ms | 78 ms | -33% | -31 ms |
| South Carolina, US | 127 ms | 263 ms | 70% | 136 ms |
| Northern Virginia, US | 87 ms | 234 ms | 92% | 147 ms |
| Oregon, US | 264 ms | 280 ms | 6% | 16 ms |
| Dallas, US | 118 ms | 177 ms | 40% | 59 ms |
| Montreal, Canada | 101 ms | 260 ms | 59% | 159 ms |
| São Paulo, Brazil | 544 ms | 678 ms | 2% | 134 ms |
| Santiago, Chile | 498 ms | 574 ms | 14% | 76 ms |
| Average | 228.89ms | 311.89 ms | 30% | 83 ms |
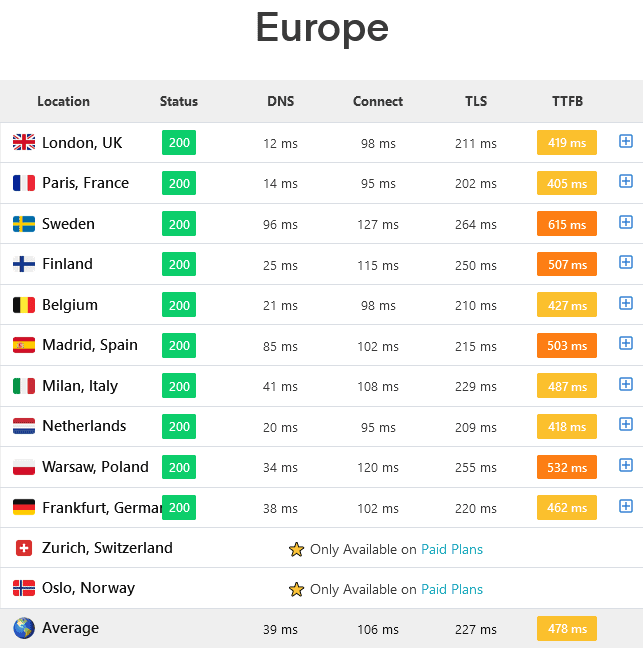
Here’s the TTFB for Europe for RunCloud.
Here’s the TTFB for Europe on WP Engine
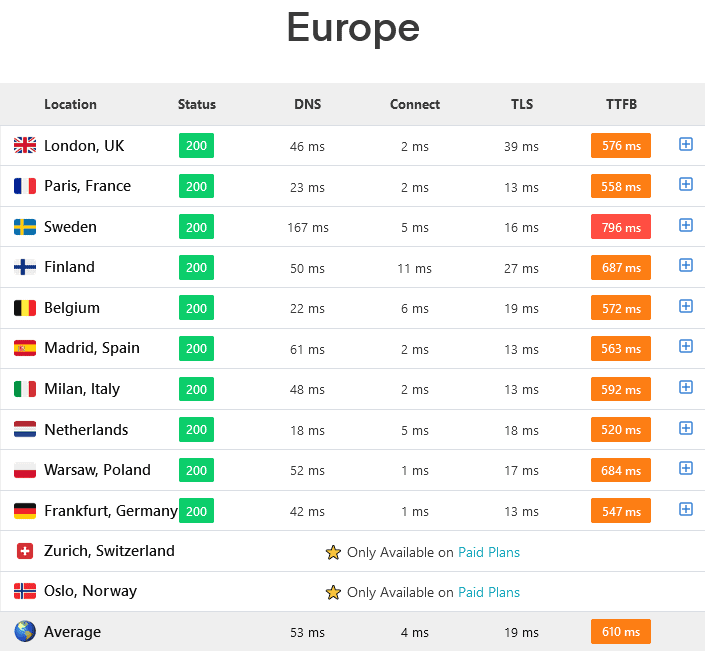
Average TTFB is 478ms vs 610ms. About 24.26% better TTFB on my setup on RunCloud vs WP Engine.
As it is clearly seen, RunCloud a much faster TTFB vs WP Engine.
If you would like to migrate from WP Engine, or any WordPress performance issues, get in touch.

1 comment
Shaikh Masood Alam
Great article and comparison!
I noticed that you’re using the Chicago server for RunCloud. Could you please update the article with the server configuration details?
TTFB is an excellent metric for evaluating any server or setup. However, it would be even better to include real user stress test results, first paint time, and full loading time.